CHAPTER 6. CONFORMATIONS OF ORGANIC MOLECULES
(Arthur Cammers and Ashley Jolly Steelman 2019 with excerpts from Timothy Soderberg, Organic Chemistry with a Biological Emphasis, 2016, 305-306)
Learning Objectives:
1. Appreciate that substances at all temperatures move at the molecular and atomic level and the higher the temperature the greater the kinetic energy in material. (■■)
2. Be able to use Newman projections to show conformations of aliphatic and substituted aliphatic chains. (■■)
3. Evaluate Newman projections in terms of relative energies. (■■)
4. Be able to read the conformational energy diagram. Make the analogy to the reaction energy diagram. Identify stationary states and transition states. (■■)
- Be able to compute Keq of conformational distributions.
6. Define the steric effect. How does it relate to Pauli exclusion? What does it have to do with this chapter?
7. How does conformation in carbocycles relate to the naturally occurring carbohydrates?
8. State clearly, why the chair in saturated 6-membered rings is not flat and why it is a low-energy conformation.
9. Recognize axial and equatorial are different to cis- and trans- substituents. (■■)
10. Recognize axial and equatorial positions in perspective drawings of carbocyclic conformation. (■■)
11. Be able to draw chair conformer perspectives and translate these into energies.
12. How do we use A-values to gauge the relative stabilities of conformers and how are they related to substituent size? (■■)
13. How does the conformational distribution of five-membered rings differ to that of six-membered rings? (■■)
14. Be
able to explain the basis of an NMR experiment in terms of the spin state of a
nucleus (α-to-ß), and the frequency of radiation absorbed. (■■)
15. Be
able to predict trends in chemical shifts for protons and carbon atoms in
different bonding positions and provide a rationale for the trend. (■■)
16. Recognize
symmetry-related atoms in a structure.
17. Define and be able to use the terms heterotopic (■■), homotopic (■■), enantiotopic (■■), and diastereotopic (■■) as they relate to atoms
in molecules.
18. Understand
how to use proton chemical shift integration values to determine the
stoichiometry of H atoms in a molecule. (■■)
19. Understand
the differences between 1H and 13C NMR spectroscopies,
and explain why 13C spectra generally have more noise to signal than
1H. (■■)
20. Explain
why 13C NMR are most often decoupled, and the reason peak
integration of chemical shifts is not possible in decoupled spectra. Be able to
use C─H multiplicities.
21. Be
able to explain the physical basis of spin-spin coupling in 1H-NMR
spectra. (■■)
22. Be
able to interpret/draw splitting diagrams for 1H-NMR spectra with
complex coupling.
23. Be
able to use the 'n+1 rule' and be able to track peak intensities in splitting
patterns with Pascal’s Triangle. (■■)
24. Given
a molecular formula (or a combination of combustion data and /or molecular mass),
you should have a working knowledge about how to solve an unknown structure
based on a 1H and /or 13C-NMR, IR, or UV-Vis spectra.
6.1 INTRODUCTION MOLECULAR DYNAMICS
(Arthur Cammers, University of
Kentucky, 2019)
 Image: Ted Van Pelt “Warped Tour Mosh Pit” Cropped and
modified, License.
This
static image of dancers does not capture the dynamic chaos in the ■ mosh pit. Likewise, no one drawing of a molecule represents its
true dynamic nature – they change with time! Naturally, no static depiction of
the MOs totally represents the MOs of a molecule; MOs adjust instantaneously on
the fly with changes in molecular shape, bond lengths and bond angles.
These atomic parameters of the molecule change with normal thermal motion. We
usually represent molecules and the MOs, in the lowest-energy shape about which
the molecule oscillates, as a pendulum oscillates around the ■ equilibrium position. The kinetic energy associated with microscopic atomic and
molecular motion determines the macroscopic bulk measurement of temperature.
Parameters such as heat capacities and molar ΔSf
characterize the internal energy as a function of temperature. The faster the
average speed of the microscopic motions, the greater the macroscopic bulk value
of temperature will be. This issue was discussed when we addressed reaction
spontaneity. Here, we take a microscopic view of molecules to discuss conformational
changes, and their relation to molecular structure and reactivity. We might be
inclined to ignore this dynamic level of complexity in molecular behavior.
After all, the atomic movements we discuss here constitute the heat content of
molecular samples. Heat translates to temperature, which is a bulk phenomenon
of the statistical average of molecular and atomic motion. It turns out that we
need to discuss these high-energy molecular conformations to explain certain
aspects of reactivity.
6.2 CONFORMATIONS OF OPEN-CHAIN NEWMAN PROJECTIONS
(Soderberg, Timothy, "Organic Chemistry with a Biological Emphasis Volume I" (2016). Chapter 3. Section 3.1 pp 133-145). Modifications: ‘[…]’ in the text indicates removal of internal references and errata. Additional sections not from Soderberg (2016) have their own attribution following each section heading. Soderberg’s original images were redrawn.)
[…] We learned [previously] that single bonds in organic molecules are free to rotate, due to the ['head-on'] nature of their orbital overlap. Consider the carbon-oxygen bond in ethanol, for example: with a 180° rotation about this bond, the shape of the molecule would look quite different:

Molecular motion in ethanol as C−O σ bond rotates by 180°
Or ethane: rotation about the carbon-carbon σ bond results in many different possible three-dimensional arrangements of the atoms.

Molecular motion in ethane as C−C σ bond rotates
These different arrangements, resulting from σ bond rotation, are referred to in organic chemistry as conformations. Any one specific conformation is called a conformational isomer, or conformer.
In order to better visualize different conformations of a molecule, it is convenient to use a drawing convention called the Newman projection. In a Newman projection, we look lengthwise down a specific bond of interest – in this case, the carbon-carbon bond in ethane. We depict the ‘front’ atom in the usual manner for line structures, and the ‘back’ atom as a larger circle.

Newman projection of the staggered conformation of C2H6.
The six carbon-hydrogen bonds are shown as solid lines
protruding from the two carbon atoms. Note
that we do not draw bonds as solid or dashed wedges in a Newman projection. Looking down the C−C
bond in this way, the angle formed between a C−H bond on the front carbon
and a C−H bond on the back carbon is referred to as a dihedral angle.
The lowest energy conformation of ethane, shown in the figure above, is called the ‘staggered’ conformation: all of the dihedral angles are 60°, and the distance between the front and back C−H bonds is maximized.
If we now rotate the front CH3 group 60° clockwise, the molecule is in the highest energy ‘eclipsed' conformation, where the dihedral angles are all 0° (we stagger the bonds slightly in our Newman projection drawing so that we can see them all).

![]() [ Newman projections of eclipsed conformation. It is
somewhat embarrassing to draw the eclipsed conformer because we would like to
put one H atom right on top of the other, but then we would hide three H atoms.
We put them close enough to convince the reader that we are showing the
eclipsed state. Indicators ( ) signal
that these H atoms are strongly interacting. ]
[ Newman projections of eclipsed conformation. It is
somewhat embarrassing to draw the eclipsed conformer because we would like to
put one H atom right on top of the other, but then we would hide three H atoms.
We put them close enough to convince the reader that we are showing the
eclipsed state. Indicators ( ) signal
that these H atoms are strongly interacting. ]
Another 60° rotation returns the molecule to a second staggered conformation. This process can be continued all around the 360° circle, with three possible eclipsed conformations and three staggered conformations.
Now let's consider butane, with its four-carbon chain. There are now three rotating carbon-carbon bonds to consider, but we will focus on the middle bond between C2 and C3. Below […] [are] representations of butane in a conformation which puts the two CH3 groups (C1 and C4) in the eclipsed position, with the [C−C−C−C atoms] at a 0° dihedral angle.

Highest-energy eclipsed state of butane [ a transition state ]
If we rotate the front, […] carbon by 60° clockwise, the butane molecule is now in a staggered conformation.

A low-energy staggered state of butane
The staggered state with the methyl groups proximal to one another is called the gauche conformer. [ a stationary state for butane ]
This is more specifically referred to as the gauche conformer of butane. Notice that although they are staggered, the two methyl groups are not as far apart as they could possibly be. A further rotation of 60° gives us a second eclipsed conformation [ a transition state / energy barrier ] in which both methyl groups are lined up with hydrogen atoms.

Lowest-energy eclipsed state of butane. [ This is another transition state. ]
One more 60° rotation produces the lowest-energy staggered conformation called the anti conformation, where the two methyl groups are positioned opposite each other (a dihedral angle of 180°).

Lowest energy staggered state of butane, the anti conformer.
As with ethane, the staggered conformations of butane are energy 'valleys', and the eclipsed conformations are energy 'peaks'. However, in the case of butane there are two different valleys, and two different peaks. The gauche conformation is a higher energy valley than the anti conformation due to steric strain, which is the repulsive interaction caused by the two bulky methyl groups being forced too close together. Clearly, steric strain is lowest in the anti conformation. In the same way, steric strain causes the eclipsed conformation - where the two methyl groups are as close together as they can possibly be - to be higher in energy than the two eclipsed conformations.
The diagram below summarizes the relative energies for the various eclipsed, staggered, and gauche conformations of butane. [ You should read this diagram in the same way that read the reaction energy diagrams in which the curve maxima are transition states, barriers to rotation, and the curve minima are stationary states.
One might imagine that there are an infinite number of conformations that one can visit as the dihedral angle above is rotated in ethane. That is flawed thinking. The theory of structure should be framed in terms of the reaction energy diagram, in which structures oscillate around low-energy equilibrium points called stationary states (in this case, the three staggered conformers in ethane). In this way, the staggered conformer possesses a lifetime before it changes into another staggered conformer, expressible by some real number in seconds. These are stationary states on the conformational energy diagram. The eclipsed conformation is a transition state on the conformational energy diagram. It is a kinetic energy barrier between staggered conformations. The molecule reaches a point on the x-axis (HCCH dihedral angle = 60°) then has to decrease in energy no matter which direction it goes on the x-axis. The molecular ‘conformers’ at the top of the potential energy curve are transition states. They are temporally undefined—they have no definite lifetime.

Because the anti conformation is lowest in energy (and also simply for ease of drawing), it is conventional to draw open-chain alkanes in a 'zigzag' form, which implies anti conformation at all carbon-carbon bonds. The figure below shows, as an example, a Newman projection looking down the C2-C3 bond of octane.

[ Often organic chemist use R
groups to indicate alkyl chains or other groups of atoms. When using R groups
you should always let your reader know what the R group stands for. ]
|
Exercise 6.2.1 Calculate the concentration of the anti conformer to gauche conformer at 20 °C for butane. Careful, how are you going to deal with the fact that there are two gauche conformers and only one anti conformer? |
|
Exercise 6.2.2 Draw Newman projections of the lowest and highest energy conformations of propane. [You do not have to complicate this task by considering the two C−C bonds because they are identical, so these would have identical Newman projections.] |
|
Exercise 6.2.3 Draw a Newman projection, looking down the C2-C3 bond, of 1-butene in the conformation shown below (C2 should be your front carbon).
|
|
Exercise 6.2.4 Determine the relationship between the sets of compounds (identical, diastereomers, enantiomers, constitutional isomers.
|
6.3 CONFORMATION IN CYCLIC MOLECULES
(Timothy Soderberg, Organic Chemistry with a Biological Emphasis, 2016, Chapter 3. Section 3.2 pp 137)
Browse through a biochemistry textbook and you will see any number of molecules with cyclic structures. Many of these cyclic structures are aromatic, and therefore planar [ rings with connecting p orbitals on each atom, sp2 hybridized ]. Many others, though, are composed of sp3-hybridized atoms, and these cyclic structures are the topic in this section.
When discussing cyclic organic molecules, we will often use sugars as examples, because they are such important molecules in biological chemistry. It is important to recall [---] that many sugars exist in aqueous solution as both open-chain and cyclic forms.

[ Open-chain glucose, left. The O atom at C5 readily reacts with C1 to form a 6-membered ring, Cyclic glucose, β-glucopyranose, right. ]
One thing that you should notice in the cyclic structure shown above is that atoms or groups bonded to tetrahedral ring carbons are either pointing up (out of the plane of the page) or back (into the plane of the page), as indicated by the use of dashed or solid wedge bonds. When two substituents on the same ring are both pointing toward the same side of the ring, they are said to be cis to each other. When they are pointed to opposite sides, they are said to be trans to each other.

Ring structures in organic molecules are usually five-membered or six-membered. Three-and four-membered rings are occasionally found in nature, but are significantly higher in energy. The relative instability of these smaller ring structures can be explained by a concept called angle strain, in which the four bonds around the sp3-hybridized carbons are forced out of their preferred tetrahedral angles.

[ Cyclopropane (left) is a 3-membered ring and cyclobutane (right) is a 4-membered ring. Remember that we can indicate these with abbreviated structures at right with C atoms and H atoms implicit. Cyclopropane forces a CCC bond angle of 60° and cyclobutene forces a CCC bond angle of 90°.]
If one of the carbon-carbon bonds is broken, the ring will ‘spring’ open, releasing energy as the bonds reassume their preferred tetrahedral geometry. The effectiveness of two antibiotic drugs, fosfomycin and penicillin, is due in large part to the high reactivity of the three- and four-membered rings in their structures.

[ Fosfomycin (left) is a naturally occurring cis-disubstituted cyclopropane and penicillin G (right) has a 4-membered ring. ]
[…] The lowest energy conformation of cyclopentane and other five-membered rings is known as the ‘envelope’, with four of the ring atoms in the same plane and one out of plane (notice that this shape resembles an envelope with the flap open). The out-of-plane carbon is said to be in the endo position (‘endo’ means ‘inside’).

Envelope conformation of cyclopentane
[…] At room temperature, cyclopentane undergoes a rapid pseudorotation process in which each of the five carbons takes turns being in the endo position.
One of the most important five-membered rings in nature is a sugar called ribose – recall [---] that DNA and RNA are both constructed upon ‘backbones’ derived from ribose. Pictured below is one thymidine (T) deoxy-nucleotide from a stretch of DNA:

The lowest-energy conformations for ribose are envelope forms in which either the 3' or 2' carbons are endo. This has very important implications for oligonucleotide structure – in a DNA double helix, it is [ the 2’ C atom ] that is in the endo position, while in RNA it is [ the 3’ C atom; remember that RNA has an OH substituent at the 2’ C atom ].
6.3.1 Conformation in Cyclohexanes
In six-membered cycloalkane structures, bonding angles are close to tetrahedral, and thus ring strain is not a factor – these rings are in fact very stable. However, the ‘flat’ drawings we have been using up to now do not accurately show the actual three-dimensional shape of a five- or six-membered ring. If cyclohexane were indeed flat, the bond angles would have to be distorted from 109.5° to 120°. If you build a model, though, you will find that when you rotate the carbon-carbon bonds to put the ring into a shape that resembles a reclining beach chair, all of the carbon-carbon bonds are able to assume tetrahedral bonding angles.

[ The chair conformer of cyclohexane with explicit (middle) and implicit (right) C and H atoms. Molecular models are very useful to help visualize conformation in carbocycles. ]
This chair conformation is the lowest energy conformation for cyclohexane and other six-membered rings. An alternate conformation for a six-membered ring is called the ‘boat’:

[ The boat conformer of cyclohexane. Structures with explicit (left) and implicit (right) C and H atoms. You may choose to draw the boat in these two different ways or rotated in any orientation. ]
In the boat conformation, two of the substituents – those on the ‘bow’ and the ‘stern’ if you will – are brought close enough to each other to cause steric strain. An additional cause of the higher energy of the boat conformation is that adjacent hydrogen atoms on the 'bottom of the boat' are forced into eclipsed positions. For these reasons, the boat conformation is a high energy conformation of cyclohexane, about 30 kJ /mol less stable than the chair conformation.
6.3.2 Drawing Cyclohexane Conformers
If you look carefully at your model of cyclohexane in the chair
conformation, you will see that all twelve hydrogens are not equivalent in
terms of their three-dimensional arrangement in space. Six hydrogens are axial – that is,
they are pointing either straight up or straight down relative to the
ring. The other six hydrogens are equatorial,
meaning that they are pointing away from the perimeter of the ring, either
slightly up or slightly down. (The
equatorial vs axial distinction is often hard to see at first - it would be a
very good idea at this point to sit down with your instructor or tutor and work
with a modeling kit).

This is not the only possible chair conformation for cyclohexane. On your model, rotate one of the ‘up’ carbons down, and one of the ‘down' carbons up. You now have a new, alternate chair conformation – this process is called ring inversion or [ring flip].

What you should recognize here is that, as a result of the ring inversion process, all of the axial and equatorial hydrogens have traded positions – axial hydrogens have become equatorial, and vice-versa. Notice, however, that the [ H atoms bound to bottom of the ring ] are still [ bound to the bottom of the ring ], and the ‘up’ hydrogens are still pointing up regardless of whether they are axial or equatorial. [ In other words, H atoms that are trans to each other remain trans to each other after inversion. Likewise for H atoms that have a cis relationship. ] At room temperature, cyclohexane is constantly inverting between two chair forms of equal energy – it is a rapid equilibrium situation. […]
6.3.3 Axial /
Equatorial vs. Cis / Trans
A very common error made by organic chemistry students as they begin to learn about chair conformations is to confuse the terms axial and equatorial with the terms cis and trans. These are completely different things! For example, when two substituents on a ring are cis in relation to one another, it means that they are pointed to the same side of the ring (both up or both down). Depending on their positions on the ring, they might both be axial, both be equatorial, or one of each.

Do not make the mistake of calling two substituents trans to each other merely because one is equatorial and one is axial, or cis because they are both axial or both equatorial.
As an organic chemistry student, you will be expected to be able to draw an accurate representation of the chair conformations of six-membered cycloalkanes, which includes being able to draw axial and equatorial substituents with their correct orientations. Here, then, are some guidelines to follow:
How to draw the chair:


How NOT to draw the chair:

6.4 CYCLOHEXANE CONFORMATIONAL ENERGY
(Arthur Cammers and Ashley Jolly
Steelman, 2019)
Cyclohexane quickly inverts at room temperature on a
conformational energy diagram like butane. How does cyclohexane’s energy
diagram differ? In butane, there were four C atoms in a linear chain with the
termini free to explore space. Let us position our perspective similarly and
see if we can find analogies and differences between the conformational motion
in butane and cyclohexane as a function of atomic parameters.
The Newman projection of cyclohexane is best represented
with a double Newman projection. Recall, we draw these projections to visualize
all conformations of a molecule. This specific drawing allows us to see the
conformation of all carbon atoms within the six-membered ring. We will need to
now look down two carbon-carbon bonds and depict each one with its own
projection.


The Newman projection is very instructive. Given what we know, the cyclohexane ring inversion above depicts how substituent A switches between axial and equatorial positions. We can see that in the Newman projection the C−C−C−C dihedral angle goes between 60° and −60°, but the C−C−C−C dihedral angle can never reach 180° as it can in butane because the atoms are part of a tether. The same C−C bond would have to break to allow an anti conformation with four C atoms, so the relationship between the C atoms in the ring is gauche.
The gauche conformations in the Newman projection above, convert from chair to chair by passing through a transition state that eclipses bonds. You can demonstrate this to yourself by building a model and taking the same perspective as the Newman Projection. Now push the end of the chair that is ‘down’ to the ‘up’ position. Notice how the ─CH2─ eclipses with the ─CH2─ on the other side. The cyclohexane chair conformation is ~free of strain; all other conformations are higher-energy states. With this background, let us have a look at the conformational energy diagram for ring inversion in cyclohexane.

The boat conformation is a transition state in the conformational equilibrium of cyclohexane. The high-energy stationary state is the twist-boat conformer, whereas the low-energy stationary state is the chair.
6.4.1 Relative Energies of Substituted Cyclohexanes
We have discussed non-bonding electronic interactions in previous sections. Remember that when occupied orbitals interact with unoccupied orbitals, the interaction can lead to bonding, and bonding is the decrease of electron energy as nuclear loci approach each other. We call this kind of bond formation heterolytic bond formation and the reverse is heterolysis for bond cleavage. The same can be said for the interaction of two partially occupied orbitals, but in this case the relevant term is homolysis. When two occupied orbitals interact, the energy of the system must increase due to Pauli Exclusion and the nature of electrons as ■ Fermions instead of Bosons. The fermionic nature of electrons is why you cannot harmlessly pass your hand through the wall like Marvel Comics’ android Avenger ■ the Vision. We discussed previously that we can estimate bond length by the ■ covalent radii of atoms. We can also measure the size of atoms of given electron occupation by the ■ Van der Waals radii. Often we are interested in looking at molecules based on these atomic sizes. Another estimate of size of molecular groups and their relationship to energy comes in the form of ■ A-values (Tabulated). These values can be used in the determination of the most stable orientation of atoms in a molecule.
Cyclohexane itself is a good example of a carbocyclic system
that virtually eliminates steric and angle strain by adopting non-planar
conformations. However, as soon as a substituent is attached as in monosubstituted
cyclohexanes, we see additional interactions that
increase/decrease the energy of the molecule depending on the position, equatorial
or axial, of where the group is attached.
The
A-values are positive energies because electrons have less space in the axial
position than they do in the equatorial position of the cyclohexane ring due to
1,3-diaxial interactions shown
below. When the chair inversion occurs, the axial methyl group moves to the
equatorial position and this strain is reduced. If you examine the table of ■ A-values
(Tabulated) position,
it costs 1.70 kcal/mol more energy to put the methyl group in the axial
position vs. the equatorial position.  Note: When
the larger substituent is located in the equatorial position, strain is
reduced.
The equatorial methyl group in methylcyclohexane chair conformation is highlighted at right and rendered in CPK space-filling mode. The nuclear size is at Van der Waals radii. The analogous rendition to the left of the unfavored chair conformation clearly shows that the Van der Waals radii of the atoms are within interaction distance. This is because the methyl group occupies an axial position rather than an equatorial position as shown on the right.
How would we analyze a disubstituted cyclohexane? Let’s look at an example below.
Example 6.4.1 Draw both chair conformations for
trans-1-chloro-3-ethylcyclohexane and, using A-values, decide which the most
stable conformation is.

Solution: The chair conformation and chair inversion is shown below. Recall, upon chair inversion axial/equatorial positions exchange. In the structure on the left, chlorine is located in the axial position and costs 0.43 kcal/mol of energy. However, in the structure on the right, ethyl in the axial position costs 1.75 kcal/mol of energy. Therefore, the lowest energy (more stable) conformer is the chair conformation on the left.

|
Exercise 6.4.1 Referring to the cyclohexane conformational energy diagram, calculate the percentage of time that cyclohexane spends in each of its conformers at 25 °C. |
|
Exercise 6.4.2 Calculate chair /chair Keq for methycyclohexane given ■ A-values (Tabulated). Note these numbers are in kcal /mol. Perform calculation at 25 °C. |
|
Exercise 6.4.3 Calculate chair /chair Keq for the molecule below. Put C(=O)Me equatorial on the reactant side of the equilibrium. Perform calculation at 25 °C.
|
|
Exercise 6.4.4 Examine the A-values for the methyl, ethyl, i-propyl and t-butyl substituents. Explain the odd jump in energy from i-propyl to t-butyl. Try looking down the axial bond in a Newman projection. Always position the group in the lowest-energy conformation. |
|
Exercise 6.4.5 (Soderberg, 2016) Draw the lowest-energy chair conformations of a) trans-1,2-dimethylcyclohexane, and b) trans-1-isopropyl-3-methylcyclohexane. Draw all substituents on all carbons (including hydrogens), being sure that the axial or equatorial orientation is clear. |
|
Exercise 6.4.6 (Soderberg, 2016) Can a 'ring inversion' change a cis-disubstituted cyclohexane to trans? Explain. |
|
Exercise 6.4.7 For the cyclohexane derivative shown below, (a) draw both chair conformations.
(b) Compare the energies of the chair conformations. If they are different, identify the higher and lower energy conformations. If the energies are the same, write “the same.” |
|
Exercise 6.4.8 Draw the chair structure that matches the Newman projection of the cyclohexane derivative shown.
|
6.5 CHAIR CONFORMATIONS in CYCLIC CARBOHYDRATES
(Timothy Soderberg, Organic Chemistry with a Biological Emphasis, 2016, Chapter 3. pp 137)
Recall that five- and six-carbon sugars such as glucose and fructose exist in solution in open chain and cyclic forms. Glucose, in its most abundant form in solution, is a six-membered ring adopting a chair conformation with all substituents equatorial.

Chair conformations of glucose in cyclic (pyranose) form.
The most abundant form of fructose in aqueous solution is also a six-membered ring.

Chair conformations of fructose in cyclic (pyranose) form.
The lower energy chair conformation is the one with three of the five substituents (including the bulky –CH2OH group) in the equatorial position.
|
Exercise 6.5.1 (Soderberg, 2016) Draw the two chair conformations of the six-carbon sugar mannose, being sure to clearly show each non-hydrogen substituent as axial or equatorial. Predict which conformation is likely to be more stable. Explain the reason for your choice.
|
6.6 CHAIR CONFORMATIONS IN SATURATED POLYCYCLIC STRUCTURES
(Arthur Cammers, 2019)
Questions of conformation also appear in saturated rings in multicyclic organic molecules. As observed in cyclohexane, the ring restricts some conformational change since the atoms in a ring are locked together.

Bicyclo[4.4.0]decane or more popularly decalin has two fused 6-membered C-atom rings and it comes in two stereochemistries, cis- and trans-, so named by the stereochemistry of the two fusion points. However, the fact that only one of these molecules can undergo ring inversion while the other must remain rigid and cannot undergo a ring inversion requires some explanation.

The attempt to invert the ring in the right half of the decalin molecules above shows that the spatial disposition in the cis- isomer interchange in the way that cis- 1,2-dimethylcyclohexane interchanges axial and equatorial groups. The virtual tether between the two groups returns to an equivalent length as in the pre-inversion structure. However, the trans- isomer has an issue. When Mother Nature attempts ring inversion of the trans- isomer, the tether connecting the two C atom substituents needs to lengthen to accommodate the fact that the two C atoms acquire a 1,2-diaxial spatial relationship, but the tether does not stretch without breaking bonds. This effect locks trans-decalin, but leaves cis-decalin flopping around, in a similar manner to cyclohexane.

The enzyme ■ 5α-Reductase catalyzes the conversion of testosterone to the more active male sex hormone dihydrotestosterone. Here, structural arguments regarding 5- and 6-membered rings, chair conformations, ring fusion, stereochemistry, Van der Waals radii, electronegativity and hydrogen bonding all converge in our ability to analyze the structure at right above into a rigid bumpy, oblate structure. We recognize that the molecule can accept hydrogen bonds at one end and donate hydrogen bonds at the other. In the middle of the molecule, interactions with solvent or other species depend on weak dispersion effects since the atoms connected, C and H do not differ much in electronegativity. We can take a guess regarding how the structure of the enzyme-binding site should look. We expect a cavity to be a hydrogen bond acceptor at one end and a hydrogen bond donator at the other. Since water is the solvent of life, we expect that much of the enzyme cavity should be aliphatic to match the middle region of dihydrotestosterone. In this way, liquid water will tend to squeeze this region out of solvation and into the cavity, thereby increasing the Keq of binding between dihydrotestosterone and reductase.


Dihydrotestosterone CPK (left) and atomic charge (electronegativity)(right).

Dihydrotestosterone crystallized in the active cavity of 5α-reductase. The tyrosine sidechain rendered as ball-and-stick. The water molecules are rendered as red balls sans H atoms.
Drugs that inhibit 5α-reductase combat male-pattern baldness, benign prostate tumors, and certain complications in gender reassignment. I found the crystal structure of the enzyme co-crystallized with dihydrotestosterone and ■ NADPH, the cofactor enabling the addition of the chemical equivalent of H2 across the double bond in testosterone. To be compatible with the aliphatic middle of the molecule, the enzyme pocket in which we find dihydrotestosterone is largely composed of amino acids with hydrocarbon side chains. The O atom of the O=C end of dihydrotestosterone sticks out of the pocket and it is hydrogen bound to a water molecule in the crystal. The OH function is also hydrogen bound to water molecules inside the enzyme and within hydrogen bonding distance to the sidechain of the OH group of the amino acid ■ tyrosine.
I took a blind guess at what I would find, and I can rationalize what I see based on my knowledge of organic chemistry. This protein structure and those of many more enzymes are freely available online.
|
Exercise 6.6.1 Draw out the two chair conformers of ■ cis-9-methyldecalin. Bicyclic structures are usually numbered such that the fused atoms are numbered last, so this molecule has a methyl group bound to one of the C atoms between the two rings. Calculate the Keq for the chair inversion. |
|
Exercise 6.6.2 Which isomer should be more stable cis- or trans-decalin? Explain. |
|
Exercise 6.6.3 Should
the structure below be conformationally mobile? Explain.
|
6.7 NUCLEAR MAGNETIC RESONANCE SPECTROSCOPY (NMR)
(Arthur Cammers, 2019)
NMR spectroscopy is arguably the most powerful method of gaining structural information about organic compounds. NMR involves an interaction between electromagnetic radiation (radio waves) and the nucleus of an atom.

In this section, we decipher 1H NMR spectroscopy; after we are done you will be able to read the 1H NMR spectrum of ethyl acetate above. The subject of spectroscopies will arise in all future chapters to help us make connections to the subject under consideration. The window into the secret world of molecules is certainly spectroscopy. Most of what we know about molecules is spectroscopic. Questions about structure, conformation, and how quickly conformers might interconvert get addressed with spectroscopic studies. To address structure and conformation in organic molecules, nuclear magnetic resonance spectroscopy (NMR) reigns among all other spectroscopic methods available.
Some nuclei are NMR-active and others are not. We name elements
and their isotopes as (p+n)p, where p is
the ■ atomic number that characterizes the
element (1 = H; 3 = Li, 6 = C, etc) and n is
the number of neutrons in the nucleus. For NMR-activity p+n
(■ mass
number), cannot be an even integer. Oh, poop, right? Organic chemistry
focuses on the C atom and the isotope that accounts for ~99% of it is 12C, and according to this it’s NMR-inactive,
and that’s bad right? … no actually that’s good, hang on stick with it; we’ll
return to this issue. In any case, nuclei with an identical number of protons
and neutrons cancel out their overall spin and their nuclear spin quantum
number,(![]() )
will be zero (
)
will be zero ( ![]() ).
Therefore, 12C is NMR inactive and will not show up in the NMR.
).
Therefore, 12C is NMR inactive and will not show up in the NMR.
Non-zero I-values give us NMR-active nuclei. • For mass number
= odd numbers with atomic number even or odd the nuclear spin QMs are ½, 3/2,
and 5/2. • For mass number = even number with atomic number odd the nuclear
spin QMs are 1, 2, or 3. The easiest NMR to do involves ![]() nuclei and the nuclei most commonly used in
organic chemistry of this type are 1H, 13C, 31P
and 19F. In the following sections, we will focus our attention on
NMR spectroscopies of the 1H isotope with natural ■ isotopic distribution = 99.99% and 13C
isotope with natural isotopic distribution = 1.07%. But for right now, we are
still talking broadly.
nuclei and the nuclei most commonly used in
organic chemistry of this type are 1H, 13C, 31P
and 19F. In the following sections, we will focus our attention on
NMR spectroscopies of the 1H isotope with natural ■ isotopic distribution = 99.99% and 13C
isotope with natural isotopic distribution = 1.07%. But for right now, we are
still talking broadly.
An NMR-active nucleus, perhaps 1H in H2O, when put in a strong magnetic field, aligns the nuclear magnetic moment with and against the field. In the absence of the field, the two states have identical energies (0 on the x-axis below). The difference in energies between the two states, aligned against (α) and aligned with (ß) the field, is given the by following equation:
![]()
where B0 is the strength of the field, and γ is the gyromagnetic ratio of the nucleus.
For 1H γ /2π = 42.58 MHz /T and for 13C γ /2π = 10.71 MHz /T. The splitting of the energy levels is ¼ as steep for 13C than it is for 1H. The unit T in the γ /2π values above stands for Tesla not temperature. ■ Tesla is a unit of magnetic field strength. Notice something in the equation above, when the units of γ /2π get multiplied by B0 the units are MHz, a frequency, and we know that ΔE = hν. This equation is just the Planck relationship in which h is the constant of proportionality between energy and frequency of electromagnetic phenomena. Do the exercise below before you continue reading. If you are completely lost, look at the ■ 6.7.1 answer in the key at the end of the chapter before you continue. The math should clear some things up.
Therefore, there is a very small difference in population between the α and ß states of a nuclear spin ½ in a strong (9.4 T) magnetic field. The resonant frequency at this field strength is 400 MHz. So, if we scanned through frequencies from 399,998,000 Hz to 400,002,000 Hz, with our water sample in that 9.4 T magnetic field, and we monitored the interference of the sample with the ■ RF source, we would see something like the following absorbance spectrum.
Way back in the day, physicist and engineers were using adiabatic magnetic transitions (■ Magnetic Refrigeration) to get as close to absolute zero temperature as they could. They realized that electrons were shifting the resonant frequency of the nucleus that they were exciting with radiofrequency by 1 – 10 ppm (parts per million). In the spectrum above, this is the reason that I expanded 5 ppm on either side of 400 MHz. 1 ppm of 400 MHz is 400 Hz and 5x that is 2000, so my spectrum above runs from the (■ Larmor Frequency minus 2 kHz to +2 kHz past the Larmor frequency.
Because this shift was due to the electrons, they called it the chemical shift and tried their best to work around these small effects that were, more often than not, difficult to model. They did their best to ignore them. The chemists noticed this and said … ‘so, ahem … what are you calling that effect again; did you say chemical shift; did we hear you right?’ At that point chemists really needed another technique to look at molecules; NMR was an advantage!
|
Exercise 6.7.1 Let’s get you involved. (a) At applied magnetic field, B0 = 9.40 T, what is the frequency associated with the EM phenomenon above for the 1H nucleus? (b) The two states, α and ß
have exactly the same ΔS values. What is the equilibrium constant for
state conversion at 20 °C: α (c) Which frequencies in the EM spectrum will this nuclear α /ß absorb? Which frequencies in the EM spectrum are relevant to 1H NMR absorption? |
6.7.1 Chemical Shifts in NMR
Chemical shifts are the reason chemists care about nuclear spectroscopy at all. We are chemists; we are interested in electron energies and electron densities and electron MOs! In general, we don’t give a flying 19F about nuclei! NMR is pertinent to chemistry because the chemical shifts of a nucleus diagnose the electron density around the nucleus. Why should this be so?
The NMR–active nucleus is itself a little magnet that aligns with (ß) and against (α) a constant B0 in a small population difference (see Exercise 6.7.1). This population difference increases with increasing B0 (B0max ~ 10 T: currently the price point / functional quasi-limit of NMR spectrometers).
The electrons around NMR active nuclei are also magnetically active. The electron also has ½ spin, and its own magnetic moment, the ■ Bohr magneton. However, the electron is ~330x more responsive to magnetic fields than the 1H nucleus; the value of the Bohr magneton is 9.27E-24 J /T whereas converting units from γ(1H) gives only 2.82E-26 J /T. We can do ‘NMR’ spectroscopy with electrons when there is an odd electron in our analyte molecule; we call this very sensitive technique, ■ ESR or EPR spectroscopy. When the electrons are all paired in molecules in strong magnetic fields, they do the same thing that the nuclei do in setting up a population difference that opposes B0, in general this effect is referred to as ■ diamagnetism; this describes the magnetic properties of most organic molecules. The greater the electron density around a nucleus, the greater the atomistic diamagnetic effect, so nuclei in symmetry inequivalent environments in a molecule experience different B0; each has a different effective magnetic field.
Beff. = σ•B0, where σ is the shielding factor from the electrons.
At this point, there should be enough background information to show you where these absorption peaks show up on the ppm scale (δ scale) of the 1H NMR spectrum. The ppm scale is the x-axis. ■ Tetramethyl silane (TMS) is used as the standard (reference compound) because it is the most shielding molecule that is convenient. TMS is chosen to be zero, on the δ scale. Most other electronic environments in other molecules, shield the 1H nuclei less than TMS from the applied magnetic field B0. The NMR spectrometer is looking at the spinning frequencies of only the 1H nuclei that are shown explicitly in the molecules in the figure below. We will find that protons are shielded or desheilded depending on what other atoms they are located next to. For example, protons can be shifted downfield (higher ppm) when nearby electronegative atoms. Look at the examples below and notice how adding an electronegative atom to methane drastically changes where it is located on the NMR spectra. There are more complete ■ tables of 1H chemical shifts on the internet.
Notice that the chemical shifts for the H atoms bound directly to electronegative atoms or one bond away from electronegative atoms appear (downfield) to the left in the spectrum—at higher ppm values. Molecules for which electronegativity puts more electron density around the H nucleus will shield 1H from B0 and put the chemical shift more upfield—at lower ppm values. Notice that sp2 C−H atoms are considerably downfield of sp3 C−H atoms.
Example 6.7.1 (Ashley Jolly Steelman, 2019)
Each proton or set of protons that are in different chemical environments will give a different peak. Identify the number of signals expected in the 1H NMR spectrum of each compound:

Solution:
There are some shortcuts you can take to identify how many signals you should see in the 1H NMR. 1) The 2 protons on a CH2 group will be equivalent if there are NO chirality centers in the molecule. 2) The 2 protons on a CH2 group will NOT be equivalent if there is a chirality center in the molecule. 3) The 3 protons on any methyl group will be equivalent. We should find that both compounds below would give 4 signals on its 1H NMR spectrum. Each chemically different environment of protons is highlighted.

|
Exercise 6.7.2 How are the X−H bonds in following molecules hybridized at X?
|
6.7.2 Chemical Shifts and Residual 1H in NMR Solvent
Chemists perform liquid-state NMR analysis in a variety of different solvents. If these NMR ■ solvents had 1H nuclei, the signal from them would dominate the spectrum; we would see nothing else. Substituting the H atoms for 2H, the deuterium isotope, removes the solvent signal. These deuterated solvents, enriched with D to 99.5-99.99%, are ■ commercially available to people wanting to study chemical structure with 1H NMR. When you use these solvents, the residual H signal appears in the spectrum at the chemical shifts and multiplicities listed for the NMR solvents. This ■ table tells you that for the NMR solvent, CDCl3, you can expect a residual singlet at 7.24 δ; however, acetone−d6 CD3(C=O)CD3 has a 5-line pattern at 2.04 δ.
6.7.3 NMR Time Scale
When discussing the IR time scale, we made the case that is was well under the time it usually takes for molecules to change conformation (See the section entitled, The σ Bond in Ethane Rotates in Book Content). Since bonds vibrate more than 1,000 times before any conformational changes occur, the IR registers a frozen image of all molecular conformations on a population average. For example, the ■ gauche conformer of butane contributes less to the IR spectrum than the anti conformer because there are fewer of them on a population-average thanks to
![]() .
.
The NMR time scale is a bit more complicated, but for simplicity less say it is about 1 s. For conformations like butane and cyclohexane, the NMR sees a time-average instead of a population-average because these conformers occur in one molecule many times before the NMR can register any information about the molecule. Illustrated below are population-averaged views and time-averaged views of two molecules in a sample. Decreasing the temperature to about −100 °C will afford the NMR spectrometer a population-average picture instead of a time-average picture of the cis-disubstituted cyclohexane below. At lower temperature, switching between populations is much slower because it immobilizes the molecules movement. The 1H NMR distinguishes between the axial and equatorial H atom shown in the stereoisomer below. At temperatures low enough, two different signals appear in the NMR spectrum instead of one time-averaged, part-axial-part-equatorial signal, for this H atom. Of course, this applies to all the other axial and equatorial H atoms in the molecule.

6.7.4 NMR and Molecular Symmetry
Considering any molecular structure and the atoms in it, if one can exchange one atom with another by rotating the molecule or internally rotating σ bonds, the two atoms are chemically identical. These have the same chemical shift in the NMR spectrum. We call this spatial relationship between two (or more) atoms homotopic. In the image below (1) the three atoms H, H’ and H” can be exchanged by sequential 120° rotations and are homotopic (2) by the same argument Ha, Hb and Hc are homotopic. A perpendicular 180° rotation exchanges the a-b-c sets of H atoms with the H-H’-H” set to form (3), making all six axial H atoms under consideration homotopic. The six equatorial H atoms in this single chair conformer could analogously exchange by the same series of three rotations (2 x 120° + 180°) and are also homotopic.

Because conformational inversion rapidly exchanges the axial and equatorial H atoms on the NMR timescale, these two sets of 6 C atoms are conformationally homotopic. The 1H NMR registers a time-average signal for all 12 H atoms bound to cyclohexane in the alkane region at 1.43 ppm. The 1H NMR spectrum of cyclohexane has only one chemical shift at room temperature.
At −100 °C, the axial and equatorial H atoms produce two chemical shifts because conformational inversion slows down to less than 1 s; this is below the NMR times scale. For the frozen cyclohexane chair conformation, no symmetry operation can convert axial to equatorial; the two atomic sets, axial and equatorial, are heterotopic; they have different chemical shifts. H atoms bound to different elements also are termed heterotopic because no symmetry operation can exchange them. Heterotopic atoms in a molecule are chemically different; the bond dissociation energies of heterotopic atoms are not the same. All other physicochemical properties of heterotopic atoms are also different.
In the figure below, you will notice that 1,3-dimethylsubstitution on the cyclohexane rings has broken the (120°) 3-fold rotational and (180°) 2-fold rotational symmetries of the molecule. Now as we rotate by 120° or 180°, we can tell that the rotation happened. If the symmetry is present in the molecule, we cannot tell the difference between before and after the symmetry operation. However, you can find a reflection plane that translates the two explicit axial H atoms into one another. These two atoms are enantiotopic, and like enantiomers, they have the same physicochemical properties. Enantiotopic atoms have the same chemical shift. Even though Hb and Hc in the Figure above are related by a reflection plane, they are not enantiotopic they are homotopic. Unlike the two enantiotopic halves of 1,3-dimethycyclohexane and the two enantiotopic halves of the coffee mug below which are enantiomeric, the two homotopic halves of cyclohexane are identical and not enantiomeric.


At this point, you might guess that we have diastereotopic atoms that have different chemical shifts, since we can have enantiotopic atoms with the same chemical shifts. Since there exist enantiomers and diastereomers, there likely exists enantiotopic and diastereotopic atoms in molecules. Let us keep using the six-membered cyclic structure to find diastereotopic atoms with different chemical shifts.

We have already established that Ha and Hb are enantiomeric because a reflection plane interconverts their positions. But no reflection plane interconverts atoms Hc and Hd. Both Hc and Hd are bound to the same atom so their atomic connectivities are the same. They differ in how they are disposed in space. Hc and Hd in the molecule above are diastereotopic. Think about it for a moment … the di-equatorial methyl groups will prefer this chair conformation to the chair that puts both methyl groups axial. Hc in an equatorial position experiences a different steric interaction than does Hd in an axial position so the chemical shifts of Hc and Hd are different.
Example 6.7.2 (Ashley Jolly Steelman, 2019)

For each of the following compounds, determine whether the two protons shown in red are homotopic (same ppm), enantiotopic (same ppm), or diastereotopic (non-equivalent).

Solution:
The first compound is homotopic with an axis of rotational symmetry that allows one proton to rotate into the other without changing anything.
The second compound is enantiotopic. If one of the red H atoms is replaced with D for a new molecule, and repeat this process for the other H atom. We produce a pair of enantiomers.

The third compound is diastereotopic. The two protons are not chemically equivalent and would show up as two separate signals on the NMR spectra. The hydrogen on the dash is in closer proximity to the –Br group since it is also pointing back into the plane of the page on a dash. A similar procedure as the one above gives us diastereomers.

|
Exercise 6.7.3 Count the number of unique 1H NMR chemical shifts in the following molecules. Use the ■ correlation tables (at the top of the list in the left margin at the website) 1-4 to estimate their ppm values.
|
6.7.5 NMR Integration and the Beer-Lambert Law
Let’s reexamine the NMR spectrum of ethyl acetate from the start of this section. You will notice that there are lines above the peak patterns with numbers associated with them. This is a measure of A, the absorption of the sample at each chemical shift region. You can look at the molecular structure of ethyl acetate (below) and identify three unique chemical shifts. Two of the peaks are from two heterotopic methyl groups (composed of 3 H atoms) and one more chemical shift from two enantiotopic H atoms in the CH2 group (exchanged by reflection plane).
![]()

Obviously, there are stoichiometric differences in these chemical shifts with the two methyl groups possessing three H atoms each and the CH2 group possessing only two H atoms. The NMR spectrum is a true absorption of EM radiation and as such it obeys the Beer-Lambert law:
![]()
The ε value for each H atom is very similar. The pathlength L is the same because the H atoms are in the same sample container (an ■ NMR tube). However, the concentrations of the H atoms depend on their stoichiometry with the CH2 H atoms being 2/3 the concentration of the CH3 atoms. This is the reason that measuring the absorption of each region and assigning a value of 2 to the smallest region will give two values of 3 in the other two regions. The chemical shifts in the NMR spectra have intensity on the y-axis that depends linearly on concentration. A computer will calculate the area under each signal and display it as a numerical value placed above or below the signal. That area is represented with a step-curve. These integration values will tell us the # of protons giving rise to a signal.
6.7.6 J-Coupling in NMR
Now that I drew your attention back to the spectrum of ethyl acetate, you noticed the extra lines … surely, and you are wondering about them. This is the most difficult aspect of 1H NMR that I have to explain, J-coupling. This could get very complicated. We are going to limit our introductory discussion about NMR to first order J-coupled splitting patterns. With these patterns, coupling trees are fairly simple to draw. Let us take a closer look at the ethyl acetate 1H NMR spectrum.
J-coupling is the interaction of two NMR-active nuclei mediated by the electrons in the bonds that connects them. The chemical shift is one value on the ppm axis. J-coupling splits this frequency into some number of frequencies. Depending on whether it is aligned α or ß, the neighboring H nucleus can either enhance or decrease the effective magnetic field perceived by the observed H nucleus (red circle below). When the orbitals are parallel as in the Newman projection below, this enhancement or reduction is greater. Since the neighboring H nucleus J-couples the observed nucleus, instead of one line, there are two. The chemical shift is the average value on the ppm axis of these two lines.

A lot can be ascertained from how the pattern is split. As you know, MOs interact in a π fashion with stronger interactions when the orbitals are parallel. The anti-relationship of the two nuclei results in the greatest J-coupling with two lines separated by ~15 Hz. As we change the dihedral angle, the J-coupling decreases then increases again. This relationship is called the ■ Karplus curve.

Immediately you can see that by measuring the J-value we can say something about the spatial relationship of two H atoms on a cyclohexane ring, whether they are di-axial with J-value ~15 Hz. If the dihedral angle is smaller ~60° with corresponding J ~5 Hz, the corresponding conformation holds both H atoms equatorial, or one is axial and the other is equatorial. A molecular model in hand can assist your visualization of these relationships.
J’s are mutual. When we turn our attention to the other atom as the observed nucleus, its chemical shift is also split by the same Hz value.
With one nearest H atom neighbor, the observed H chemical shift is split once producing two lines, this pattern is called a doublet. With two nearest neighbors we have two situations to consider: Scenario (1) The two interacting H nuclei are not symmetry related. This gives two different J values and produces four lines of equal intensity. Scenario (2) The two interacting H nuclei ARE symmetry related. This will give one J value and produce four lines but the two lines in the middle overlap. The overall relative intensities of the three-line pattern is 1: 2 : 1.

I am a fan of scenario (1); there is less confusion; I get more data (two J’s instead of one) out of my analysis. The small J value is measured as the difference in Hz between lines 1 and 2; or between lines 3 and 4. The large J value is measured as the difference in Hz between lines 1 and 3; or between lines 2 and 4.
In scenario (2), two symmetry-unrelated H nuclei splitting the observed nucleus can have similar J values, and still produce a pattern that looks like a 1: 2: 1 triplet.

Let us read the spectrum of ethyl acetate with what we have so far using all the cool verbiage that we learned. The chemical shift at 2.42 δ is due to an H nucleus that is five bonds away from the closest H atom. Five-bond HH coupling constants: 5JHH, in conformationally mobile molecules are too small to measure. Therefore, this chemical shift is a singlet. The chemical shift at 1.86 δ is coupled to two enantiotopic H nuclei with chemical shift = 4.28 δ by a three-bond coupling constant, 3JHH = 7 Hz. This 3JHH is typical of straight chain alkanes. The positions of the three lines are: 192.9, 185.8, 178.9 Hz. The J values are just the differences between the values of lines 1 and 2; and lines 2 and 3. Take note of the coupling tree above the triplet in the figure above.
Now we turn our attention to the four-line pattern at 4.28 δ. Obviously, three nearest neighbors can split a chemical shift into 23 = 8 lines. However, when the J values are identical due to symmetry, the two interior lines are a sum of 3 overlapping lines. Look at the coupling tree above the expansion of the four-line pattern above. This pattern is a quartet with line intensities 1: 3: 3: 1. The values of the lines in Hz are 438.3, 431.4, 424.4, and 417.3. As we can see by the coupling tree in the diagram above, the J values are just the differences between the lines (1,2), (2,3), and (3,4).
When the chemical shifts split due to J coupling patterns emerge with some number of peaks; we refer to this as the multiplicity of the splitting pattern. If one neighboring nucleus splits the chemical shift into two lines, the multiplicity of this pattern is ‘doublet.’ Two symmetry-related nuclei split the chemical shift into 3 lines; this multiplicity is triplet with line intensities 1: 2: 1. We saw the case in which there are 3 symmetry-related neighboring nuclei giving multiplicity quartet and intensities 1: 3: 3: 1. We can tell how many symmetry-identical nearest neighbors there are for each signal in this case by subtracting 1 from the number of lines in the pattern with intensities that follow ■ Pascal’s triangle; this is the n+1 rule. J values are extracted from the patterns by calculating the difference in Hz that separates each line; these differences should be identical.

Example 6.7.3 (Ashley Jolly Steelman, 2019)
What would be the expected splitting pattern of the 1H NMR signals of the hydrogen atoms indicated by the arrows?

Solution:
The number of peaks within a signal can be determined by the magnetic affects of neighboring protons. Use the n + 1 rule where n = number of neighboring protons to determine each integration.

|
Exercise 6.7.4 Answer the questions about this portion of a 1H NMR spectrum. a) How many symmetry-related 1H nuclei are there for this 1H NMR signal? b) What is the value of J? c) At the B0 of this instrument, the H nucleus frequency is 100 MHz. The central line in the pattern below is 300.2 Hz away from TMS (the chemical shift at 0 ppm). What is the chemical shift in ppm of the line pattern? d) Propose a structural scenario that would produce this pattern.
|
6.7.7 Stepwise Analysis of First Order 1H NMR Coupling
First order patterns are characterized by chemical shifts (Hz) separated on the frequency axis by more than the J value: Δνab >> Jab for HA and HB. Perhaps a good rule of thumb is Δνab at least 3x bigger than JAB. When the chemical shifts get close, 2nd order effects creep into the line patterns. The effect is demonstrated in the figure below as chemical shift νa approaches νb with J = 10 Hz.

First order patterns tend to lean toward each other. Notice in the figure how the intensities of the doublets are not quite 1:1. 2nd order effects increase as the difference in chemical shift between Ha and Hb approach Jab in Hz (Δνab ─► Jab) the inner peak intensity grows and the outer one shrinks. Furthermore, the chemical shift is no longer the average of the frequencies of the two lines of the doublet, it shifts toward the tall line. This morphing doublet continues until the two patterns collapse into a singlet; at that point the two chemical shifts would be at the same energy. These 2nd order effects can be sneaky, at νb = 3.2 and νa = 3.0 δ, one might mistake this pattern for a quartet.
|
Exercise 6.7.5 The spectrometer in the figure above is operating at 100 MHz. At νb = 3.2 and νa = 3.0 δ and Jab = 10 Hz what is the unitless ratio: Δνab /Jab? |
|
Steps for 1st Order 1H NMR
Splitting Analyzing 1st order splitting patterns. This is something you are actually going to have to do for it to make sense. We will have a few examples for you. Step 1: Decide if the pattern can be analyzed with a first order approach. Step 2: Look for Pascal’s triangle if you think you see it, assign multiplicities: singlet, doublet, triplet, quartet, pentet and so on. Whether you see Pascal or not in your peak pattern, extract the first J value out of the difference between the first and second peak in Hz. Step 3: Mentally assign the smallest outermost peak intensity = 1 and track the intensities of the other peaks in the pattern as near-integer multiples of the smallest peak. Step 4: All 1st order patterns are centrosymmetric…2nd order patterns can be centrosymmetric. In splitting patterns, you are looking for patterns within patterns and aiming to make a hypothesis about how the chemical shift is coupled to other nuclei. Step 5: After extracting the first J value, draw a simpler pattern above the old pattern and repeat steps 2 – 4. |
Example 6.7.6
We have two bottles containing stereoisomers of trans- and cis-crotononitrile, but we don’t know which bottle has which isomer. We know that 3JHHcis < 3JHHtrans. There are resources online, ■ NMR Data that allows the correlation of structure with both chemical shift and J. At that website, in the menu to the left, I chose ‘3JHH alkene acyclic’ and looked at the coupling constants. The trans 3JHH is bigger than the corresponding cis 3-bond coupling constant. If I can extract the chemical shifts and J values out of the NMR spectrum, I should be able to tell the difference between these two molecular substances.
![]()


It always helps to know what you are looking for.

We expect to find Ha and Hb quite downfield in the 5.0 – 70 ppm zone and we can see something there. 3Jbc should give quartet structure (3 symmetry-related H nuclei) to the splitting pattern. On the other hand, 4Jac might be expected to be quite small, and could get lost in the natural linewidth of the NMR spectrum.
Given this insight, right away you can identify Hb in the expanded regions of the spectra above. Now that we know what to look for, we can see a doublet of quartets (dq) in the upfield regions of both expansions with large spacing in the d splitting and small spacing in the q. This signal must be Ha. The doubling of the Ha pattern must be due to Hb. By visual inspection (since I made the scales of the expansions equal), Bottle B contains the cis-isomer because the material has a smaller 3Jab than the material in Bottle A.
|
dq |
trans |
Hz |
dq |
cis |
|
5.113 |
511.26 |
5.087 |
508.66 |
|
|
5.126 |
512.63 |
5.1 |
510.04 |
|
|
5.14 |
514 |
5.114 |
511.43 |
|
|
5.154 |
515.37 |
5.128 |
512.8 |
|
|
5.273 |
527.26 |
5.197 |
519.66 |
|
|
5.286 |
528.63 |
5.21 |
521.04 |
|
|
5.3 |
530 |
5.224 |
522.42 |
|
|
5.314 |
531.37 |
5.238 |
523.8 |
Ha(trans) = 5.21 δ, 3Jab = 16 Hz; 4Jac = 1.4 Hz; Ha(cis) = 5.16 δ, 3Jab = 11 Hz; 4Jac = 1.4 Hz
Let us focus on extracting the J’s and δ’s from the spectrum Hb portion of (Z)-crotononitrile. The chemical shift δ is just the middle of the splitting pattern. We could just compute the average of the two outer peaks and we’d get 6.28 δ. Extracting J values depends on our ability to recognize the quartets. I used to tear a piece of paper to make bench marks on it that would match the separation between lines 1 and 2. Then I would slide the bench mark along to find line 3 and line four of the first q. The intensity patterns of these four lines have to be 1: 3: 3: 1 or it is not a q. Doing likewise from the other side of the pattern allows the location of the other q. Condensing the two quartets to two lines basically simplifies the pattern to a doublet. Following the tree lines down to the actual pattern tells you that you can extract the d J value from the difference between lines 1 and 3 in Hz.

Hb (cis) = 6.28 δ, 3Jab = 11 Hz; 4Jbc = 6.8 Hz
|
dq |
trans |
dq |
cis |
|
|
6.359 |
635.86 |
6.122 |
612.19 |
|
|
6.425 |
642.47 |
6.189 |
618.91 |
|
|
6.491 |
649.15 |
6.232 |
623.18 |
|
|
6.519 |
651.85 |
6.257 |
625.69 |
|
|
6.559 |
655.87 |
6.299 |
629.91 |
|
|
6.586 |
658.61 |
6.325 |
632.53 |
|
|
6.653 |
665.28 |
6.367 |
636.69 |
|
|
6.719 |
671.86 |
6.435 |
643.52 |
|
Exercise 6.7.7 Describe the chemical shift of the methyl group in the (E) and (Z) stereoisomers of crotononitrile. |
This example was created from the ■ SDBS spectra data base. Have a look at the full spectra there. Search for crotononitrile.
6.7.8 Protic 1H NMR Chemical Shifts and Dynamic States
Notice in the ■ figure that correlates chemical shift with various molecular structures and functional groups that the protic H nuclei have chemical shifts that appear to have a wider range than the non-protic chemical shifts. Remember that protic refers to an H atom bound to an electronegative atom. A multitude of states that interconverted on the diffusion timescale explained the broadness of the IR spectroscopic features for the protic functions. While slow on the IR timescale, diffusion interconverts states in the range of quick to comparable to the NMR timescale. For this reason, the protic peaks tend to appear broader than the non-protic peaks.
The nature of the protic peak produces a greater range for them in general than the non-protic peaks. The C─H bond does not change the electronic distribution around the C and the H atom as a function of the state of the molecule as much as the protic peaks tend to do. Cast your mind back to the discussion of hydrogen bonding when intermolecular interactions held our attention.
(1) X─H-----:Y vs. (2) X--H-----:Y vs. (3) X:-----H--:Y vs. (4) X:-----H─Y
You can parse the line above into a concept of a highly variable electron density around the H atom in an hydrogen bond. Bonding scenarios (1) and (4) might have quite a bit more electron density around the H nucleus and thus a more upfield position in the NMR spectrum than bonding scenarios (2) and (3) which leave the H nucleus quite naked and more exposed to B0.
The take home summary of hydrogen bonding in protic H nuclei is
1. The ranges of protic chemical shifts are larger than that of C─H 1H chemical shifts. It is more difficult to predict where you will find them.
2. Depending on the dynamic nature of the protic chemical shifts they tend to be broad; sometimes they can broaden to the point that they disappear into the baseline of the spectrum.
3. Often protic peaks hide under other peaks, affecting the baseline of the otherwise sharp information-rich chemical shift.
4. The dynamic nature of hydrogen bonding tends to remove J splitting from the chemical shift. This is not always the case.
5. The more acidic groups tend to be more downfield at higher δ values due to a greater fraction of time spent away from the electrons on the conjugate base during dynamic exchange.
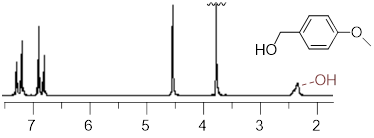
An example of a broad protic peak (~2.4 δ) in the 1H NMR spectrum.
6.7.9 The NMR Time Scale
In acquiring an NMR spectrum, data is gathered with an RF pulse instead of the method (pre-1970’s, ■ history) described above in which the RF window of interest is scanned and individual absorptions registered. The RF window of NMR is so small that with short intense pulses all the frequencies of interest can be excited at once.
Look very closely at the Figure of the ■ NMR scan above. The nucleus absorbs radiation at a particular energy. This quantum mechanical system only allows one energy for the transition from α to ß states. After the scan passes the absorption frequency, the system no longer absorbs hv, it relaxes to its equilibrium population with α states in excess of ß states. After a pulse, the detector records this free induction ■ decay back to equilibrium. The instrument software does Fourier analysis on the recorded intensity versus time data to convert it to intensity vs. frequency data, which is an NMR spectrum. The time axis in the free induction decay defines the timescale of the NMR experiment. If signals last long enough, the peaks will be sharp otherwise, they will be broad.
Compared to IR, UV-vis and optical rotation spectroscopies are instantaneous, likewise compared to NMR, IR is also superfast. Look at the EM spectrum and gain an appreciation about how the timescale of spectroscopies function inversely to energy and to the EM frequency of the phenomena.
6.7.10 A Few More Notes about NMR Spectroscopy
Due to the nature of transistors and the physics of it all, it is easier to modulate the electric field and excite the system in that manner instead of modulating B0. For this reason, NMR spectroscopists endeavor to keep B0 as constant as possible. The Larmor (absorption) frequency of the 1H nucleus names the constant field strength of the NMR spectrometer. So that 9.4 T magnetic field spectrometer tends to get called a 400 MHz spectrometer, no matter which nucleus is being observed.
When you make a measurement on a 400 MHz spectrometer, the δ values and the J coupling values remain the same as your measurement with the same sample on a 100 MHz spectrometer. However, the Hz values of the chemical shifts are 4 times as large on the 400 MHz spectrometer as they are at 100 MHz. In other words, at 400 MHz the chemical shifts are separated by 4 times the frequency than at 100 MHz. For example, a chemical shift at 4.0 δ at 400 MHz = 1600 Hz from TMS (0.0 δ); however, the 4.0 δ shift at 100 MHz has only 400 Hz between it and 0 δ (TMS).
Since ΔE = hv = γB0 /2π, we understand that the frequency associated with the α /ß transitions is a linear function of applied field, B0. However, if we divide both sides by h•B0, and refer to v /B0 in terms of ppm or δ, all we have on the right side of the equation is a constant. v / B0 = δ = ppm = γ /h2π. However, the chemical shift is dependent on the Beff = σ•B0. Shielding (σ) occurs because the electron magnetic moment opposes the field like the α state opposes B0. Shielding is also a linear function of B0, and the addition of two linear functions is just a linear function. So, it’s no surprise that the chemical shift of an H nucleus in a molecule is the same no matter what spectrometer (B0) is used.
However, why should Jab stay constant? J is simply a parameter that tells us how strongly two nuclei are connected quantum mechanically. Think about a doublet graphically below in which a J-coupled H nucleus (indicated by ‘) witnesses an α─►ß transition. The B0-dependent transition ΔE is indicated in the figure at right. The figure below greatly exaggerates the difference between ΔEß and ΔEα; ΔE is in MHz while J is in Hz, a difference of 6 orders of magnitude.
Remember the definition of first order patterns. The frequency difference in chemical shift should be larger than the coupling constant between the two chemical shifts: Δνab >> Jab. This gets easier to do at higher field strengths because larger frequency ranges separate the same chemical shifts at elevated magnetic fields. Therefore, by switching instruments, and going to a higher field strength, you can turn 2nd order splitting patterns into first order splitting patterns.
Diastereotopic H nuclei tend to have large 2Jab and small Δνab so these structural features often (not always) give rise to 2nd order splitting. Higher field strength simplifies these patterns; the chemical shift region containing the diastereotopic H nuclei shown on the CH2 of (-)-menthoxyacetic acid recorded at 100 and 500 MHz. The 500 MHz pattern is just analyzable as a pair of first order doublets, whereas it is inappropriate to so at 100 MHz.

The chemical shifts above are 4.20 and 4.10 δ with 2JHH’ = −16.7 Hz. Don’t worry about the negative sign, positive J’s look very similar to negative J’s. 1J and 3J are usually positive whereas 2J is usually negative.
Find (−)-menthoxyacetic acid in the ■ SDBS spectra database, search the name. It is amazing that the one of the two diastereotopic methyl groups is closer in 1H δ to the methyl group on the other side of the molecule (0.93 and 0.91 δ) than it is to its diastereotopic partner (0.79 δ).
|
Exercise 6.7.8 a) Does (−)-menthoxyacetic acid have to be optically pure (only one enantiomer) to give the diastereotopic signals shown above? b) Why or why not? c) Could we tell the difference between (+)- and (−)-menthoxyacetic acid by 1H NMR? If you think so, explain what you would do to get different NMR spectra for the enantiomers. |
(Arthur Cammers, 2019)
What happens when a significant portion of a molecule lack C-H bonds, take a look at the Chlordane? These difficulties are largely resolved by probing the carbon atoms of a molecule by NMR in the same fashion as the hydrogen atoms.

Next, we learn about 13C NMR spectroscopy. With the background that we developed to this point, I do not have a lot to do. We can utilize much of what we learned in 1H NMR to discuss 13C NMR spectroscopy. To focus our attention, let us start by considering a spectrum. Since we have so much fresh context with the 1H NMR of (−)-menthoxyacetic acid, we begin with the 13C NMR spectrum of the same molecule. Here we are aiming at quick-start literacy of the spectrum, getting familiar with its scope, and some supporting theory. Initially we can make the most progress by highlighting differences and similarities between 13C and 1H NMR; we will do this in the form of Q&A. Before you read, my answers, give the question a little thought. The concepts will probably stick better if you do.
25 MHz 13C NMR spectrum of (−)-menthoxyacetic acid.
Q1: Since 1H and 13C are NMR-active why don’t we see 1H signals in the 13C signals above?
A1: The Larmor frequency of 1H at 9.4 Tesla is 400 MHz, at the same applied field the Larmor frequency of 13C is 100.6 MHz because the gyromagnetic ratio of 13C is 25% of the gyromagnetic ratio of 1H. The entire spectral window above from 0 – 200 MHz is only 20,000 Hz. So, the left edge of the 13C spectrum above is still 400E6 Hz – 2E4 Hz = (4E8 – 2E4) Hz ≈ 4E8 Hz away from the right edge of the 1H spectrum. We can tune the instrument to observe and excite 13C nuclei; the frequencies of the detector and emitter are so far from those of 1H that 1H peaks do not appear.
Q2: Don’t 13C nuclei couple with each other? They are NMR active. There is a complex structure and yet there are only singlets in the spectrum. By the way, why didn’t 13C nuclei couple with 1H in 1H NMR?
A2: 13C nuclei strongly couple with themselves, and with 1H nuclei: 1JCH range from 120 – 300 Hz and in high-quality spectra 1JCH, and 2JCH can appear when one expands the 1H spectrum vertically and examines the baseline. Often one can find 1H doublets at either side of splitting patterns, but the intensity of these is ~ 0.5% of the 1H pattern. Only 1 out of 99 times will there be an NMR-active C nucleus to split the signal from the 1H nucleus. The fact that 1JHC creates a doublet decreases this small intensity by 50%. These peaks at 0.5% of the intensity of the regular 1H peaks hide in the baseline. Now you know why I said that it is a good thing we do not have a popular NMR-active C nucleus ■ above. Our 1H NMR spectra would be tropical jungles of peaks … or we would have to work much harder to clean them up.
We don’t see any JCC in the carbon NMR because at 1.1% 13C abundance the probability of having two C atoms bound together to see JCC is 0.01152 • 100% ~ 0.0132% … or 1.3 parts in 10,000; this is basically the same issue encountered when trying to see JCH in 1H NMR.
Q3: Why don’t the 1H atoms bound to C atoms split the 13C signals in the spectrum above? 99.99% of the 13C─H bonds have 1H atoms, NMR-active nuclei. Where is JCH?
A3: The 1H atoms indeed split the 13C peaks into Pascal-triangle multiplets depending on how many are bound! These large J values complicate the 13C spectrum, so acquisition methods edit them from the data. Typically, when we acquire 13C spectra we edit JCH from the spectrum in the following manner.
Q4: The integrals look a bit messed up. The peaks appear as thin lines, but they are not all equally as tall. Don’t peak integrals work in 13C? Does not the Beer-Lambert law apply?
A4: Yes, the Beer-Lambert law still applies to the 13C quantum transitions, but not with the 1H decoupler on. With the decoupler set up correctly, most of the 13C signal can come from 1H by magnetization transfer. Above, the 25 MHz 13C NMR spectrum of (−)-menthoxyacetic acid is likely at very high concentration, and the product of only a few scans. Often getting a carbon spectrum is sample-limited. In these cases, spectrometers get reserved overnight or for days to obtain enough data to elevate the weak 13C signals out of the noisy baseline. The efficiency of magnetization transfer is better when there are H atoms directly attached, but it also depends on weird stuff like how quickly certain σ bonds rotate, and how quickly 13C nuclei relax from the excited state. In any case, unequal transfer of 1H magnetization to the 13C signal in decoupled spectra prevents the use of Beer’s EM absorption law (NMR integration).
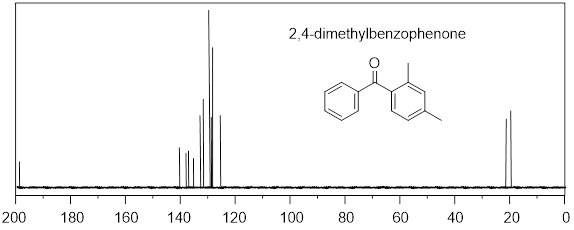
|
Exercise 6.7.9 a) In the spectrum above, how many 13C NMR chemical shifts should 2,4-dimethylbenzophenone produce? Make an argument based on symmetry. |
6.8.1 Chemical Shifts in 13C NMR
Q5: Why is the ppm range for 13C of ~200 ppm larger than that of 1H at ~11 ppm?
A5: The 13C chemical shift dispersion is about 220 ppm, this actually makes a lot of sense. Remember that electron shielding causes one 1H nucleus to differ in frequency (chemical shift) to another in the strong magnetic field. The H atom has two electrons in its ‘octet’ and most of the density is on C in C─H, and even more electron density is on X in X─H due to electronegativity. So not only is shielding comparatively low for H, but variability in shielding is also low compared to the C atom which has six more local electrons than the bonded H atom and enjoys much more variability in bonding and electron shielding (σ).
Wide chemical shift ranges in 13C NMR affords the user with more unique peaks in similar chemical environments. How many chemical shifts would you expect for octane? Due to the fact that we can put the chain in a conformation with an axis of rotation, C atoms 1-4 are homotopic with C atoms 8-5 respectively. Therefore, due to symmetry, we would expect to see 4 unique peaks in the 13C spectrum of octane. Obviously, there is a point where the carbon chain length would become so long that the distinct CH2 δ will come together and not be distinguishable. Do you think you can figure out about how many C atoms in a straight chain that would take?

|
Exercise 6.7.9 To gain an appreciation for the extent of dispersion in the 13C NMR chemical shift, find out approximately how long the straight alkane chain would have to be before we can no longer distinguish each symmetry-unrelated δ. Hint: Access the ■ SDBS spectra database, increase the chain length. |
Electronegativity and hybridization affect the 13C chemical shift via the shielding argument in the same way that they move the 1H NMR signals to higher ppm. Given the 1H NMR structural ■ correlations present in the H NMR section, you can basically make sense out of the spectrum of 2,4-dimethylbenzophenone.
Given what I told you about decoupling and magnetization transfer and the effect of electronegativity on 13C δ, can you assign the peak list below to the structure?
![]()
(1) 16.01, (2) 28.17, (3) 31.11, (4) 118.56
There are a couple things we should notice here. 1) carbon atoms (a) and (d) are in closest proximity to electronegative atoms and carbon atom (d) is sp hybridized which would also move its signal further downfield. We will find that (d) is located at 118.56 ppm and (a) is located at 31.11 ppm. 2) As for carbon atoms (b) and (c), we should recognize that (c) is the furthest away from both electronegative atoms and because of this we can assign it to 16.01ppm. This leaves us to assign carbon atom (c) to 28.17ppm.
Let’s look at a more complicated example, can you partially assign the peak list below to the structure?

(1) 20.07, (2) 21.37, (3) 125.78, (4) 128.35, (5) 129.24, (6) 130.08, (7) 131.89, (8) 132.82, (9) 135.65, (10) 137.26, (11) 138.26, (12) 140.62, (13) 198.52
There is no doubt about C(e), it is found at the furthest downfield (highest ppm). C(a, f, k, and i) are grouped in the spectrum. C(b and c) are obvious in the spectrum; even though you don’t know which is which. Likewise C(l and m) are grouped in the spectrum; even though we don’t know which is which. Given this structure, the spectrum, fits the data.
Repeat this for the 13C NMR of (−)-menthoxyacetic acid ■ above. You should be able to assign 3 peaks unambiguously. You can check your assignment in the ■ SDBS spectra data base.
Note: In doing problems involving 13C NMR often, the H multiplicity is given. With one H atom attached since 1H has nuclear spin quantum number = ½ the multiplicity is d, doublet. Likewise, multiplicities of t and q apply to two and three H atoms attached.
Some 13C NMR structural correlations are below, but to use 13C NMR effectively one has to use ■ databases intelligently and think about symmetry relationships in molecules.


KEY TO Chapter 6 EXERCISES
![]()
As you know, for the reaction
exponent = 2 has to appear in the Keq
for the concentration of A. However, one conformer does not distribute mass in
the same manner. No exponent is necessary. How does Mother Nature handle the
fact that there are two grauche conformers for every anti? There must be some
effect. This is hidden in the multiplicity of states. The gauche conformer has
more entropy associated with it and this entropy ends up in the value for
ΔG, so we don’t have to worry about it.
![]()
EXP({ΔG(gauche) − ΔG(anti)}/RT)
= Keq = 4.9 in favor of anti.
Exercise 6.2.2 Answer Newman projections for propane.
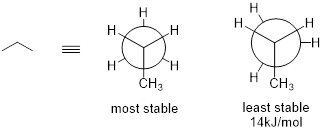
Exercise 6.2.3 Answer

Exercise 6.2.4 Answer
A: enantiomers B: constitutional isomers
Exercise 6.4.1 Answer
Ignore the transition states. Remember that these don’t exist for any definable time. There are two stationary states; with the twist boat 21 kJ /mol higher in energy than the chair.
![]()
ΔG = -RTLnKeq, R = 8.31 J/Kmol, T = 298
2.1E4 J/mol = −8.31 J/Kmol •298K•LnKeq; LnKeq = -8.47; Keq = 2.0E−4 = [t-boat] /[chair]
Set [chair] = to 1 and that makes [t-boat] = 2.0E−4
Percent time as t-boat = 2.0E−4 /(2.0E−4 +1) •100% = 0.02% of the time cyclohexane is in the t-boat. 99.98% of the time the material is in the chair conformation.
Exercise 6.4.2 Answer
The energetic cost of putting Me axial = 1.7 kcal /mol
![]()
1.7 kcal /mol = −0.00198 kcal/mol•K 298 K•ln(Keq)
Keq = 0.056; 056/(1+056)•100% = 5% of the material is axial and 95% of the material is equatorial.
Exercise 6.4.3 Answer

ΔG – ΔG’ = –RTLnKeq
1.17 – 1.23 = –0.06 kcal /mol = –RTLnKeq = −0.00198 kcal/mol•K 298 K•ln(Keq)
Keq = 1.11; 1.11/(1.11+1)•100% = 53% of the time the molecule holds thiocyanide equatorial (and acetyl axial) and 47% of the time thiocyanide axial (and acetyl equatorial). The product as written above is the major conformer, but not by much.
Exercise 6.4.4 Answer
 This is a Newman
projection looking down the axial bond of the isopropyl (red) substituent. The
t-butyl substituent adds another methyl group where the red H atom is. This is
obviously a high-energy conformation due to the two new gauche interactions
created by the substitution. Ethyl, and i-Pr can hang
a methyl group out away from the ring. The t-Bu group cannot avoid these gauche
interactions.
Exercise 6.4.5 Answer
The lowest-energy chair conformations of a) trans-1,2-dimethylcyclohexane
First parse the name into a line structure; since absolute configuration is not specified draw either enantiomer:
![]() then parse the line
structure in to a chair conformation:
then parse the line
structure in to a chair conformation: ![]()
b) trans-1-isopropyl-3-methylcyclohexane
First parse the name into a line structure; since absolute configuration is not specified draw either enantiomer:
 since you are asked
represent the lowest-energy chair conformation we need to put iPr in the equatorial position.
![]() since the substituents are on opposite sides of the ring, the
methyl group is axial in the 3 position relative to the iPr
group.
since the substituents are on opposite sides of the ring, the
methyl group is axial in the 3 position relative to the iPr
group.
Exercise 6.4.6 Answer
Q: Can a 'ring inversion' change a cis-disubstituted cyclohexane to trans? Explain.
A: No it cannot, the chair-to-chair conformational change does not break bonds and switch the side of the ring to which the substituents are connected. These changes only dispose substituents along the axis of the ring or out toward the equator of the ring.
Exercise 6.4.7 Answer

Me(ax) or Me(eq)
The Me(ax) conformation is the lowest-energy conformer because Et has a larger A value than Me.
Exercise 6.4.8 Answer
 The C atom bearing OH
is S in absolute configuration and the OH group is in the equatorial position. The
C atom bearing the Me is S in absolute configuration and the Me group is in the
axial position.

Exercise 6.5.1 Answer
Q: Draw the two chair conformations of the six-carbon sugar mannose, being sure to clearly show each non-hydrogen substituent as axial or equatorial. Predict which conformation is likely to be more stable. Explain the reason for your choice.

A: Four substituents are on the same side of the ring and on is on the opposite side. Let’s be careful to get the stereochemistry right and parse this structure into chair conformations.
 and
and 
OH, and CH2OH are bigger than H. The conformer on the right put four OH and CH2OH groups in axial positions. The conformer on the left puts only one non-H group in an axial position.
Exercise 6.6.1 Answer
You don’t need a calculation. By examination Keq = 1. cis-9-methyldecalin holds the methy group axial with respect to one ring (red ring in reactant), but equatorial with respect to the other (black ring in reactant). The Me group is axial on the left ring and equatorial on the right ring in the leftmost structure. Successful chair inversion means that this relationship has to interchange. The two chair conformations are in 1: 1 equilibrium. ΔG = 0.

Exercise 6.6.2 Answer
trans-decalin should be more stable because it is just two fused chairs and there are no axial substituents. Cis-decalin has native axial substituents. One of the C-C bonds in the other ring must be axial and the other equatorial for both rings to maintain chair conformation. Examine the structures below.
![]()
Exercise 6.6.3 Answer
Should the structure below be conformationally mobile? Explain.
A better question might how should one answer this question. The best method is to build a model and play with it. The short answer is no, the structure is not conformationally mobile.
![]() Each cycle locks the other. The C-C bonds of one ring are
axial in the other and vis-versa. If either ring inverts it can only adopt the
boat or a high-energy twisted boat conformation.
Each cycle locks the other. The C-C bonds of one ring are
axial in the other and vis-versa. If either ring inverts it can only adopt the
boat or a high-energy twisted boat conformation.
Exercise 6.7.1 Answer (a) At applied magnetic field, B0 = 9.40 T, the frequency, ν = 42.58 MHz /T • 9.40 T = 400 MHz.
(b) ΔE = hv = 6.63E−34 J•s • 42.58E6 /s = 2.78E−26 J or 2.78E−26 J • 6.022E23 [ ] /mol = 1.68E−2 J /mol = ΔH, the energetic separation between the two states. ΔS of the transition = 0 since both states are associated with the same entropy. ΔH ≡ ΔG. 1.68E−2 J /mol = ΔG = −RT Ln(Keq) ; 1.68E−2 J /mol /8.314 J /molK /293.2 K = −6.89E−6 = Ln(Keq); INVLN (6.65E−6) = 0.999993. so α :ß = 1,000,000 : 999,993.
(c) Referencing the EM spectrum on Wikipedia, it looks like 400 MHz corresponds to VHF radio waves. In fact my favorite radio station is WUKY-FM 91.3 MHz - Lexington, KY which is about ¼ the frequency the α /ß transition phenomenon, ■ back-to-text.
Exercise 6.7.2 Answer For molecules (1-4), the MO containing the electron lone pair at the X atom to which the explicit H atom is bound are in pure p orbitals to interact with the π system. This leaves two p orbitals, and one s orbital to make the σ bond XC or XH bonds, answer: sp2. For molecules (5 and 6), the MO containing the electron lone pair at the X atom to which the explicit H atom is bound are ~sp3 hybridized to distribute s character to occupied orbitals.

Exercise 6.7.3 Answer a) has 1 chemical shift at ~1.4 ppm.
b) has 3 chemical shifts at ~3.5, ~1.9 and ~1.0 ppm. The O atoms is atom number 1, at atom 2, 3, and 4 there are axial and equatorial H atoms that exchange quickly on the NMR time scale. Atoms 2, and 3 are homotopic to atoms 6, and 5 and so are the H atoms attached to these C atoms. At 90 MHz, the spectrometer does not distinguish between two of the CH2 groups in this spectrum. Search for tetrahydropyran in this ■ spectral database from the menu bar at left select the CDCl3 1H NMR spectrum.
c) has 1 chemical shift at about ~3.6 ppm. The axial and equatorial H atoms exchange quickly. Search for 1,4-dioxane in this ■ spectral database from the menu bar at left select the CDCl3 or the D2O spectrum.
d) has 8 unique chemical shifts. The 3 H atoms on the methyl group quickly rotate into each other ~1.2 ppm, the CH atom ~4 ppm, the three diastereotopic pairs of CH2 atoms at ~3.7 ppm all have different chemical shifts. The two chemical shifts in the CH2 group closest to the stereogenic C atom should differ more in chemical shift than the other two pairs of chemical shifts in the other two CH2 groups.
e) has 12 unique chemical shifts. The two methyl groups on O and C atoms have different chem shifts, The 2 CH atoms attached to 3 C atoms in one case and 2 C and 1 O atom in another case have different chemical shifts, there are four pairs of CH2 groups each with two different chemical shifts. The axial and equatorial exchange does not average these pairs because the two conformers are different; in one conformer OMe is axial and in the other COCH3 is axial.
f) Three unique chemical shifts.
g) Six unique chemical shifts. The two methyl groups are enantiotopic, same chemical shift. The H atoms on the CH2 groups are enantiotopic.
h) Ten unique chemical shifts. The methyl groups and the H atoms on the CH2 groups are diastereotopic. These diastereotopic groups should be close in chemical shift, they are probably all not distinguishable in the 1H NMR.

Exercise 6.7.4 Answer a) How many symmetry-related 1H nuclei are there for this 1H NMR chemical shift?
There are 7 lines; multiplicity = heptet. There are six 1H nuclei that are perturbing the 1H nucleus in the chemical shift.
b) What is the value of J? (314.3 – 300.2) /2 = 7.0 Hz The 3JHH = difference between the lines in Hz.
c) At the B0 of this instrument, the H nucleus frequency is 100 MHz. The central line in the pattern below is 300.2 Hz away from TMS (the chemical shift at 0 ppm). What is the chemical shift in ppm of the line pattern? 300.2 Hz /100 MHz = 3.0 ppm or 3.0 δ d)
d) Can you propose a structural scenario that would produce this pattern?

Exercise 6.7.5 Answer The spectrometer in the figure above is operating at 100 MHz. At νb = 3.2 and νa = 3.0 δ and Jab = 10 Hz what is the unitless ratio: Δνab /Jab?
For a unitless ratio we need to put numerator and denominator in the same units. We can put them both in either ppm or Hz. Let’s use Hz. Δνab = νb − νa = 3.2 − 3.0 = 0.2 ppm. At 100 MHz … 0.2 ppm x 100 MHz = 20 Hz. When νb = 3.2 and νa = 3.0 δ and Jab = 10 Hz with a 100 MHz spectrometer, Δνab /Jab = 2.
Exercise 6.7.6 Answer Describe the chemical shift of the methyl group in the (E) and (Z) stereoisomers of crotononitrile.
We have enough information to describe this peak. It is expected to be at about 2 δ from our structure to chemical shift correlation ■ chart above (or the online ■ correlation tables) and it has two J that are very different ~7 and 1.4 Hz. The multiplicity will be a dd. Since the chemical shift is so far away from the other coupling partners, the intensities will be 1: 1: 1: 1.
Exercise 6.7.7 Answer
a) Does (−)-menthoxyacetic acid have to be optically pure (only one enantiomer) to give the diastereotopic signals shown above?
b) Why or why not?
No, the H nuclei on the molecule just have to be diastereotopic. The two enantiomers will give exactly the same NMR spectrum because enantiomers have identical properties. The chemical shift is just another chemical property.
c) Could we tell the difference between (+)- and (−)-menthoxyacetic acid by 1H NMR? If you think so, explain what you would do to get different NMR spectra for the enantiomers.
As mentioned above, the spectra of the enantiomers are identical to one another. Making the ester derivative with an optically pure alcohol would generate two diastereomers and these would have different NMR spectra. We might try dissolving the simplest optically pure amine in a 1: 1 ratio in an NMR sample of the (+) enantiomer and an NMR sample of the (−) enantiomer to make diastereomeric salts in an appropriate NMR solvent to keep them in solution.
Exercise 6.7.8 Answer a) In the spectrum above, how many 13C NMR chemical shifts should 2,4-dimethylbenzophenone produce?
b) Make an argument based on symmetry.

There are thirteen 13C chemical shifts. C2 exchanges with C6 and C3 exchanges with C5 with the rotation of the C1C7 σ bond. There are no whole-molecule rotations or reflections that exchange atoms.
Exercise 6.7.9 Answer At 25.2 MHz all 5
symmetry-unrelated C atoms in decane are
distinguishable; however, in undecane, the three central C atoms have the same
apparent δ. There are 4 C atoms in dodecane with the same apparent δ.
However, 25 MHz is not a very strong magnetic field. At 11.8 T, ~500 MHz 1H
and 125 MHz 13C we would have better chemical shift dispersion.
CHAPTER 6 PRACTICE PROBLEMS
(Ashley Jolly Steelman and Arthur Cammers, 2019)
PP 6-01 Draw a Newman projection for the most stable conformation of hexane at the innermost C-C bond, indicated below.
![]()
PP 6-02 Draw the following Newman projection in its correct bridged bicyclic format.

PP 6-03 Draw a Newman projection for the most and the least stable conformations of 3‑methylhexane looking down the bolded bond indicated below, from the perspective indicated by the arrow.

PP 6-04 Given the pictorial definition of the A-value above, do you think that A-values are strictly additive? For example, would the A-value for the methyl substituent serve to calculate Keq for chair /chair conformational distributions of cis-1,3-dimethylcyclohexane to the same accuracy as it would for cis-1,3-dimethylcyclohexane to the same accuracy as it would for trans-1,3-dimethylcyclohexane?
PP 6-05 Have a look at the A-value for the ■ t-Butyl substituent and explain why the most stable conformation for cis-1,4-dit-butylcyclohexane is the twist boat. (■ t-boat cyclohexane).
PP 6-06 Look at ■ cyclohexanone. Calculate the conformational Keq of 3-methylcyclohexanone. Will your approach change if asked to calculate the conformational Keq of 4-methylcyclohexanone? For which isomer can we trust the A-values? Why?
PP 6-07 (Soderberg, 2016) Predict which of the following disubstituted cyclohexanes has a greater energy difference between its two chair conformations. State your reasons for your choices.
a) cis-1,3-dimethylcyclohexane or cis-1,4-dimethylcyclohexane
b) cis-1,2-dimethylcyclohexane or trans-1,2-dimethylcyclohexane
c) trans-1,2-dimethylcyclohexane or trans-1-isopropyl-2-methylcyclohexane
PP 6-08 Draw the following molecules in their most stable chair conformation.

PP 6-09 Menthol, isolated from various
mint oils, is used in the treatment of minor throat irritation. Draw both chair
conformations and indicate which is lower in energy (most stable).

PP 6-10 Indicate the name of the splitting pattern for the 1H NMR signals of the indicated hydrogen atoms in the boxes provided (e.g. singlet, doublet, ect.) for the following molecules. Assume J-averaging for flexible structures.
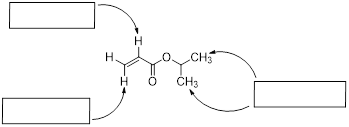

PP 6-11 Determine how many total signals the following
molecules would have in a 1H NMR spectrum.

PP 6-12 Determine how many total signals the following molecules would have in a 13C NMR spectrum.

PP 6-13 Which compound below is most consistent
with the 1H NMR data given?
a)
0.90 δ (6H, doublet)
1.40 δ (2H, quartet)
1.90 δ (1H, multiplet)
3.5 δ (2H, triplet)
4.0 δ (1H, singlet)

b)
1.09 δ (6H, doublet)
2.12 δ (3H, singlet)
2.58 δ (1H, septet)

PP 6-14 Precisely describe one
feature of the IR,1H NMR, or 13C NMR spectrum that will
tell you unambiguously whether the compound in a bottle is the first or second compound.
Note: There may well be more than one answer to each of these questions.

PP 6-15 A compound with molecular formula C5H10O displays the following IR and 1H-NMR spectra.
(a) Calculate the hydrogen deficiency index for the compound.
(b) Propose a structure for the compound that is consistent with the IR and NMR spectrum below.
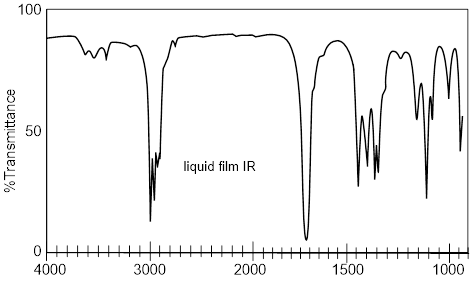

PP 6-16 Name the structures below according to IUPAC nomenclature rules.
![]()
Identify and give a specific example of how 1H NMR spectroscopy might be used to distinguish between the two compounds A and B.
PP 6-17 A compound with molecular formula C5H8 displays the following IR and 1H-NMR spectra. The 13C NMR data shows five signals at 84.5ppm, 68.3ppm, 22.1ppm, 20.5ppm and 13.4ppm. Propose a structure for the compound that is consistent with the IR and NMR spectrum in the box below.
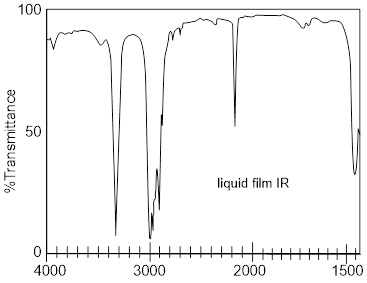

PP 6-18 A compound with molecular formula C6H7N displays the following IR, 1H-NMR and 13C NMR spectra. Propose a structure for the compound that is consistent with the data.
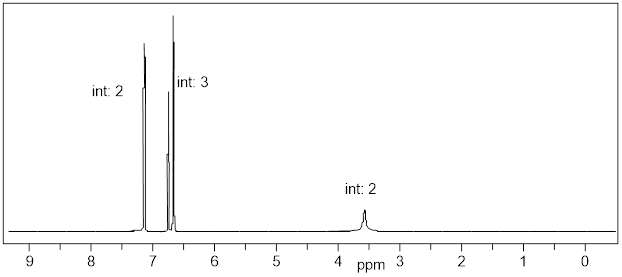
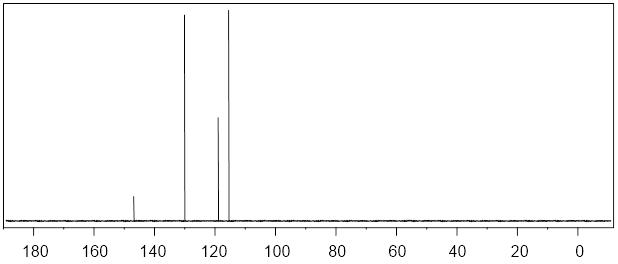
PP 6-19 A compound with molecular formula C14H10 displays the following IR, 1H-NMR and 13C NMR spectra. Propose a structure for the compound that is consistent with the data.
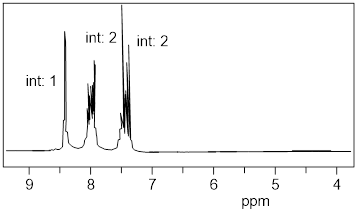
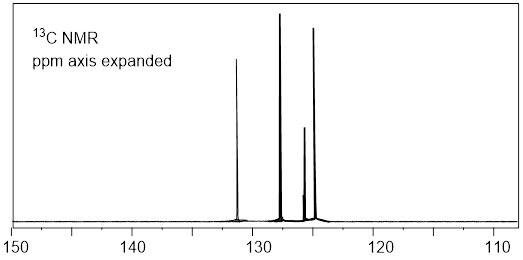
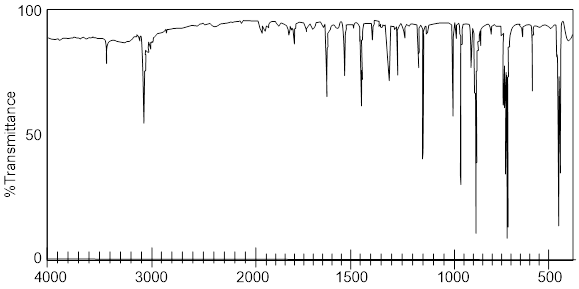
PP 6-20 A compound with
molecular formula C6H14 produces 3 signals in the 13C
NMR. Deduce the structure of the compound.
PP 6-21 A compound
with molecular formula C3H6O2 displays the
following IR and 1H-NMR spectra. Propose a structure for this
compound.
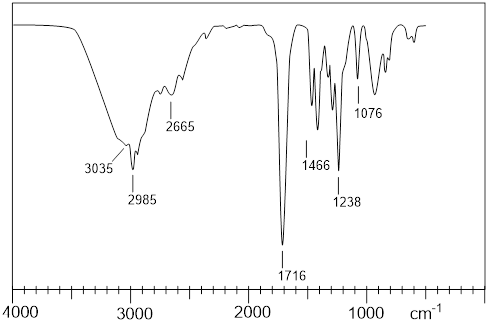
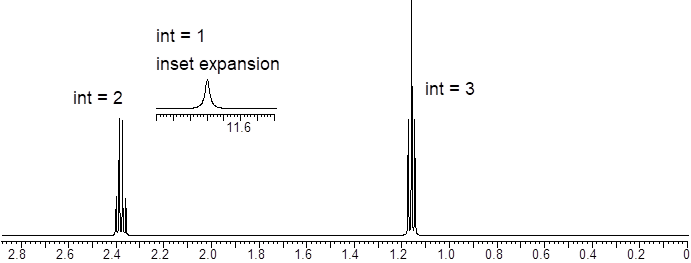
PP 6-22 The three molecules below might be difficult to distinguish by IR or MS. WHY? Explain how 1H NMR could distinguish between them.

PP 6-23 A compound with the molecular formula C12H24 exhibits a 1H NMR spectrum with only one signal and a 13C NMR spectrum with two signals. Deduce the structure of this compound.
PP 6-24 Compare the structures of cyclohexane and 2-methyl-2-pentene:
(a) What is the molecular formula for each compound?
(b) What is the HDI (DU) of each compound?
(c) Can 13C NMR be used to distinguish between these compounds? Explain.
PP 6-25 Determine the
structure of the molecule C4H4O4 below using
the spectroscopic data. 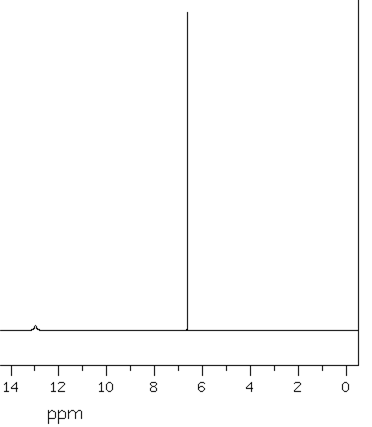
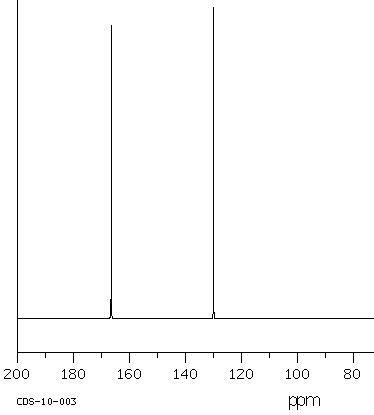
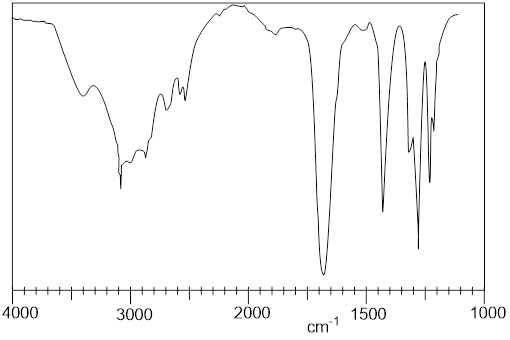
CHAPTER 6 KEY FOR PRACTICE PROBLEMS
(Ashley
Jolly Steelman, Arthur Cammers 2019)
PP 6-01 Answer The two ethyl attachments should be anti to one another (180o
apart).

PP 6-02 Answer
![]()
PP 6-03 Answer
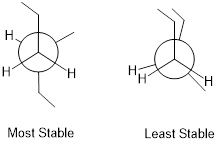
PP 6-04 Answer
A-values cannot be strictly additive. Cis-1,3-dimethylcyclohexane in the di-axial position must be higher in energy than the mere doubling of the A-value for methyl. They must ‘feel’ each other’s presence by a small amount. The bigger the substituent gets the less accurate just doubling the A-value is going to be.
PP 6-05 Answer
The most stable conformation for cis-1,4-dit-butylcyclohexane is the twist boat because the t-butyl group is too large for the axial position. To keep both t-butyl in the equatorial position the conformer has to be a boat, but the boat is a transition state. The only option is for the conformer to rest in the t-boat conformation.
PP 6-06 Answer
We
cannot trust the A-values so much for the 3-methyl isomer. The methyl group in
the axial position does not have a 1,3,5-triaxial interaction with two H atoms.
It has a 1,3,5-triaxial interaction with one H atom and an empty space left by
the flat sp2 sigma array of the C=O.

PP 6-07 Answer
Which disubstituted cyclohexanes has a greater energy difference between its two chair conformations. State your reasons for your choices.
a) cis-1,3-dimethylcyclohexane or cis-1,4-dimethylcyclohexane
Answer: cis-1,4-dimethylcyclohexane Keq =1. This one has the least energy difference. Methyls take turns being equatorial and axial. There is one methyl axial and one methyl equatorial in both chairs. The 1,4-isomer has a diaxial conformation.
b) cis-1,2-dimethylcyclohexane or trans-1,2-dimethylcyclohexane
Answer: trans-1,2-dimethylcyclohexane has the greatest difference in energy because it has a di-axial chair.
c) trans-1,2-dimethylcyclohexane or trans-1-isopropyl-2-methylcyclohexane

Answer: trans-1,2-dimethylcyclohexane has less energy difference between chairs. It is a higher-energy situation to put i-Pr axial than to put Me axial.
PP 6-08 Answer

PP 6-09 Answer

PP 6-10 Answer
Indicate the name of the splitting pattern for the 1H NMR signals of the indicated hydrogen atoms in the boxes provided (e.g. singlet, doublet, ect.) for the following molecules. Assume J-averaging for flexible structures.
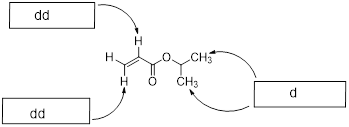

PP 6-11 Answer
1H NMR

PP 6-12 Answer
13C NMR

PP 6-13 Answer
(a) compound d (b) compound a
PP 6-14 Answer
Precisely
describe one feature of the IR,1H NMR, or 13C NMR
spectrum that will tell you unambiguously whether the compound in a bottle is
the first or second compound. Note: There may well be more than one answer to
each of these questions.

The first molecule has four 13C NMR signals; the second has eight.
The first molecule has a simpler 1H NMR spectrum due to greater symmetry.

Look for spC-H stretch in the IR spectrum and the C≡C for the second molecule.
In the 1H (upfield singlet) and 13C NMR there will be characteristic signals (sp C atoms ~75 ppm).
The vinyl group H2C=CH- gives characteristic splitting patterns
between 5-6 ppm.

The number of chemical shifts in the in the sp2 region of the spectrum will differentiate these two molecules. Anthracene has four signals and phenanthrene has seven.
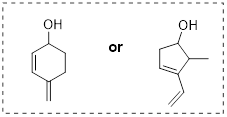
The ratios of the 1H NMR integration is the easiest way to tell
these molecules apart. The first molecule has ratios of 1: 2 only. The second
has 1: 2: 3 NMR integration ratios. The upfield methyl peak integrating to 3
will be a doublet. The second molecule will also have the characteristic
splitting pattern of the vinyl group.
PP 6-15 Answer
(a) HDI = 1 (b) 3-pentanone, ![]()
PP 6-16 Answer
(a) 4,4-dimethylpentanol (b) t-butyl peak gives a very specific 9H singlet.
PP 6-17 Answer
1-pentyne
![]()
PP 6-18 Answer
Aniline

PP 6-19 Answer
Anthracene
![]()
PP 6-20 Answer
![]()
PP 6-21 Answer
![]()
PP 6-22 Answer It would be difficult to tell these three molecules apart by solely using IR because they all have the same types of functional groups. We could utilize the symmetry difference of the substituents on the aromatic ring to determine their difference in 1H NMR. Each molecule should have different number of signals.
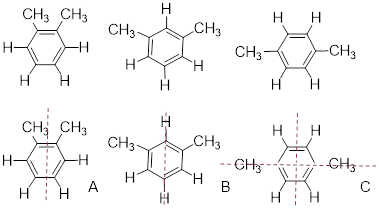
The red line is an axis of symmetry about which we can rotate to interconvert groups. For example, molecule A flips on the axis exchanging the Me groups and the two H atoms. This structure has 3 signals, with integration 3: 1: 1 in the 1H NMR.
When B is flipped along the axis shown, the Me and one H atom exchange, therefore the two Me have the same signal in the 1H NMR. Likewise the two H atoms that exchange also have the same ppm value. Two H atoms cannot be exchanged with rotation. Therefore B has four 1H NMR signals which integrate to 6: 2: 1: 1.
In C there are two elements of rotational symmetry.
The vertical rotational axis converts the upper and lower pairs of H atoms into
each other and the two Me groups. The horizonal axis interchanges the upper and
lower H atoms, thereby symmetry-relating all the H atoms. There are two 1H
NMR signals in C that integrate to 3: 2.
PP 6-23 Answer

PP 6-24 Answer: Compare the structures of cyclohexane and 2-methyl-2-pentene:
(a) What is the molecular formula for each compound? Cyclohexane = C6H12. 2-methyl-2-pentene = C6H12.
(b) What is the HDI (DU) of each compound? DU = 1 for each.
(c) Can 13C NMR be used to distinguish between these compounds? Explain. Yes. Cyclohexane would have only one signal at low ppm. 2-methyl-2-pentene has NMR signal upfield and down field. There should be six signals total.
PP 6-25 Answer Fumaric
acid


